Event
Event#
[1]:
import xarray
import numpy
import pandas
import climtas
import xesmf
import dask.array
We have a Dask dataset, and we’d like to identify periods where the value is above some threshold
[2]:
time = pandas.date_range('20010101', '20040101', freq='D', closed='left')

data = dask.array.random.random((len(time),50,100), chunks=(90,25,25))
lat = numpy.linspace(-90, 90, data.shape[1])
lon = numpy.linspace(-180, 180, data.shape[2], endpoint=False)

da = xarray.DataArray(data, coords=[('time', time), ('lat', lat), ('lon', lon)], name='temperature')
da.lat.attrs['standard_name'] = 'latitude'
da.lon.attrs['standard_name'] = 'longitude'

da
[2]:
<xarray.DataArray 'temperature' (time: 1095, lat: 50, lon: 100)>
dask.array<random_sample, shape=(1095, 50, 100), dtype=float64, chunksize=(90, 25, 25), chunktype=numpy.ndarray>
Coordinates:
  * time     (time) datetime64[ns] 2001-01-01 2001-01-02 ... 2003-12-31
  * lat      (lat) float64 -90.0 -86.33 -82.65 -78.98 ... 78.98 82.65 86.33 90.0
  * lon      (lon) float64 -180.0 -176.4 -172.8 -169.2 ... 169.2 172.8 176.4
- time: 1095
- lat: 50
- lon: 100
- dask.array<chunksize=(90, 25, 25), meta=np.ndarray>
Array Chunk Bytes 41.77 MiB 439.45 kiB Shape (1095, 50, 100) (90, 25, 25) Count 104 Tasks 104 Chunks Type float64 numpy.ndarray - time(time)datetime64[ns]2001-01-01 ... 2003-12-31
array(['2001-01-01T00:00:00.000000000', '2001-01-02T00:00:00.000000000', '2001-01-03T00:00:00.000000000', ..., '2003-12-29T00:00:00.000000000', '2003-12-30T00:00:00.000000000', '2003-12-31T00:00:00.000000000'], dtype='datetime64[ns]') - lat(lat)float64-90.0 -86.33 -82.65 ... 86.33 90.0
- standard_name :
- latitude
array([-90. , -86.326531, -82.653061, -78.979592, -75.306122, -71.632653, -67.959184, -64.285714, -60.612245, -56.938776, -53.265306, -49.591837, -45.918367, -42.244898, -38.571429, -34.897959, -31.22449 , -27.55102 , -23.877551, -20.204082, -16.530612, -12.857143, -9.183673, -5.510204, -1.836735, 1.836735, 5.510204, 9.183673, 12.857143, 16.530612, 20.204082, 23.877551, 27.55102 , 31.22449 , 34.897959, 38.571429, 42.244898, 45.918367, 49.591837, 53.265306, 56.938776, 60.612245, 64.285714, 67.959184, 71.632653, 75.306122, 78.979592, 82.653061, 86.326531, 90. ]) - lon(lon)float64-180.0 -176.4 ... 172.8 176.4
- standard_name :
- longitude
array([-180. , -176.4, -172.8, -169.2, -165.6, -162. , -158.4, -154.8, -151.2,
       -147.6, -144. , -140.4, -136.8, -133.2, -129.6, -126. , -122.4, -118.8,
       -115.2, -111.6, -108. , -104.4, -100.8,  -97.2,  -93.6,  -90. ,  -86.4,
        -82.8,  -79.2,  -75.6,  -72. ,  -68.4,  -64.8,  -61.2,  -57.6,  -54. ,
        -50.4,  -46.8,  -43.2,  -39.6,  -36. ,  -32.4,  -28.8,  -25.2,  -21.6,
        -18. ,  -14.4,  -10.8,   -7.2,   -3.6,    0. ,    3.6,    7.2,   10.8,
         14.4,   18. ,   21.6,   25.2,   28.8,   32.4,   36. ,   39.6,   43.2,
         46.8,   50.4,   54. ,   57.6,   61.2,   64.8,   68.4,   72. ,   75.6,
         79.2,   82.8,   86.4,   90. ,   93.6,   97.2,  100.8,  104.4,  108. ,
        111.6,  115.2,  118.8,  122.4,  126. ,  129.6,  133.2,  136.8,  140.4,
        144. ,  147.6,  151.2,  154.8,  158.4,  162. ,  165.6,  169.2,  172.8,
        176.4])
climtas.event.find_events will create a Pandas table of events. You give it an array of boolean values, True if an event is active, which can e.g. be generated by comparing against a threshold like a mean or percentile.
[3]:
threshold = da.mean('time')

events = climtas.event.find_events(da > threshold, min_duration = 10)

events
[3]:
| time | lat | lon | event_duration | |
|---|---|---|---|---|
| 0 | 2 | 23 | 12 | 10 |
| 1 | 3 | 1 | 12 | 11 |
| 2 | 3 | 9 | 21 | 11 |
| 3 | 3 | 20 | 6 | 11 |
| 4 | 6 | 0 | 6 | 10 |
| ... | ... | ... | ... | ... |
| 2589 | 1074 | 31 | 82 | 11 |
| 2590 | 1079 | 36 | 79 | 11 |
| 2591 | 1081 | 34 | 98 | 12 |
| 2592 | 1084 | 25 | 79 | 10 |
| 2593 | 1083 | 35 | 78 | 11 |
2594 rows × 4 columns
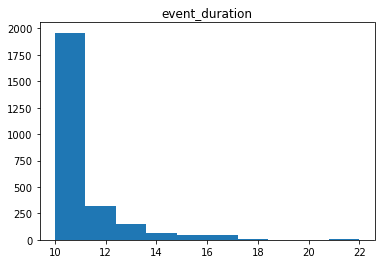
Since the result is a Pandas table normal Pandas operations will work, here’s a histogram of event durations. The values in the event table are the array indices where events start and the number of steps the event is active for.
[4]:
events.hist('event_duration', grid=False);
You can convert from the indices to coordinates using climtas.event.event_coords. Events still active at the end of the dataset are marked with a duration of NaT (not a time)
[5]:
coords = climtas.event.event_coords(da, events)

coords
[5]:
| time | lat | lon | event_duration | |
|---|---|---|---|---|
| 0 | 2001-01-03 | -5.510204 | -136.8 | 10 days |
| 1 | 2001-01-04 | -86.326531 | -136.8 | 11 days |
| 2 | 2001-01-04 | -56.938776 | -104.4 | 11 days |
| 3 | 2001-01-04 | -16.530612 | -158.4 | 11 days |
| 4 | 2001-01-07 | -90.000000 | -158.4 | 10 days |
| ... | ... | ... | ... | ... |
| 2589 | 2003-12-11 | 23.877551 | 115.2 | 11 days |
| 2590 | 2003-12-16 | 42.244898 | 104.4 | 11 days |
| 2591 | 2003-12-18 | 34.897959 | 172.8 | 12 days |
| 2592 | 2003-12-21 | 1.836735 | 104.4 | 10 days |
| 2593 | 2003-12-20 | 38.571429 | 100.8 | 11 days |
2594 rows × 4 columns
To get statistics for each event use climtas.event.map_events. This takes a function that is given the event’s data and returns a dict of different statistics. It’s helpful to use .values here to return a number instead of a DataArray with coordinates and attributes.
[6]:
stats = climtas.event.map_events(da, events, lambda x: {'sum': x.sum().values, 'mean': x.mean().values})

stats
[6]:
| sum | mean | |
|---|---|---|
| 0 | 7.720646191765621 | 0.7720646191765621 |
| 1 | 7.545168908782278 | 0.6859244462529344 |
| 2 | 8.776404953284827 | 0.7978549957531661 |
| 3 | 8.820629283522708 | 0.8018753894111552 |
| 4 | 7.350620818505183 | 0.7350620818505182 |
| ... | ... | ... |
| 2589 | 8.710790884253576 | 0.7918900803866887 |
| 2590 | 6.73266081786626 | 0.6120600743514782 |
| 2591 | 8.868592214995974 | 0.7390493512496645 |
| 2592 | 7.790211594277864 | 0.7790211594277864 |
| 2593 | 8.669867314918553 | 0.7881697559016867 |
2594 rows × 2 columns
Again this is a Pandas dataframe, so you can join the different tables really simply
[7]:
coords.join(stats)
[7]:
| time | lat | lon | event_duration | sum | mean | |
|---|---|---|---|---|---|---|
| 0 | 2001-01-03 | -5.510204 | -136.8 | 10 days | 7.720646191765621 | 0.7720646191765621 |
| 1 | 2001-01-04 | -86.326531 | -136.8 | 11 days | 7.545168908782278 | 0.6859244462529344 |
| 2 | 2001-01-04 | -56.938776 | -104.4 | 11 days | 8.776404953284827 | 0.7978549957531661 |
| 3 | 2001-01-04 | -16.530612 | -158.4 | 11 days | 8.820629283522708 | 0.8018753894111552 |
| 4 | 2001-01-07 | -90.000000 | -158.4 | 10 days | 7.350620818505183 | 0.7350620818505182 |
| ... | ... | ... | ... | ... | ... | ... |
| 2589 | 2003-12-11 | 23.877551 | 115.2 | 11 days | 8.710790884253576 | 0.7918900803866887 |
| 2590 | 2003-12-16 | 42.244898 | 104.4 | 11 days | 6.73266081786626 | 0.6120600743514782 |
| 2591 | 2003-12-18 | 34.897959 | 172.8 | 12 days | 8.868592214995974 | 0.7390493512496645 |
| 2592 | 2003-12-21 | 1.836735 | 104.4 | 10 days | 7.790211594277864 | 0.7790211594277864 |
| 2593 | 2003-12-20 | 38.571429 | 100.8 | 11 days | 8.669867314918553 | 0.7881697559016867 |
2594 rows × 6 columns